
- Powerball Jackpot Odds: 1 in 292,201,338.
- Mega Millions Jackpot Odds: 1 in 302,575,350.
- Smaller Prizes: Odds improve significantly (e.g., 1 in 24 for any Powerball prize).
- Scratch-Off Tickets: Often better odds, like 1 in 3.41.
- European Lotteries: EuroMillions (1 in 139,838,160) and EuroJackpot (1 in 95,344,200) have slightly better jackpot odds than U.S. lotteries.
Quick Comparison Table
| Lottery | Jackpot Odds | Overall Winning Odds | Minimum Jackpot |
|---|---|---|---|
| Powerball | 1 in 292,201,338 | 1 in 24.9 | $20 million |
| Mega Millions | 1 in 302,575,350 | 1 in 24 | $20 million |
| EuroMillions | 1 in 139,838,160 | 1 in 13 | €17 million |
| EuroJackpot | 1 in 95,344,200 | 1 in 49 | €10 million |
Key Takeaways:
- Odds are determined by the number of possible combinations.
- Games with smaller number pools or fewer rules often have better odds.
- Use methods like the Expected Value Calculation to assess ticket worth.
- Treat the lottery as entertainment, not a financial strategy.
Understanding odds won’t guarantee a win, but it helps you make informed choices. Let’s dive deeper into how lottery odds work and how to evaluate your chances.
How Lottery Odds Work
What Are Lottery Odds?
Lottery odds measure the likelihood of winning compared to losing. For instance, if the odds are 1:5, it means there’s one chance to win for every five chances to lose. This ratio gives players a clear picture of their chances in any lottery game.
Now, let’s break down how these odds are calculated.
How Are Lottery Odds Calculated?
Lottery odds are determined using a mathematical concept called combinations. Here’s a quick look at how some popular lottery games stack up:
| Lottery Game | Number Selection | Total Combinations | Jackpot Odds |
|---|---|---|---|
| Powerball | 5 from 69 + 1 from 26 | 292,201,338 | 1 in 292,201,338 |
| Mega Millions | 5 from 70 + 1 from 25 | 302,575,350 | 1 in 302,575,350 |
While hitting the jackpot is tough, smaller prizes in games like Powerball are much more achievable. For example, the odds of winning by matching only the Powerball number are about 1 in 38.
Odds vs. Probability: What’s the Difference?
Odds and probability might sound similar, but they’re not the same. Odds compare losing outcomes to winning outcomes, while probability shows your chance of winning as a percentage.
To find the probability, divide the number of winning outcomes by the total number of outcomes, then multiply by 100. For example, if there’s 1 winning combination out of 100 total outcomes, the probability is 1%.
Understanding this difference is especially helpful when comparing games like Powerball and Mega Millions. It gives you a better grasp of what you’re up against when choosing which game to play.
Mathematician Breaks Down the Best Ways to Win the Lottery
Major Global Lottery Odds
Knowing how the odds stack up across major global lotteries can help you decide which games might be worth your time and money. Here’s a closer look at some of the world’s most popular lotteries and their odds.
U.S. Lotteries: Powerball and Mega Millions
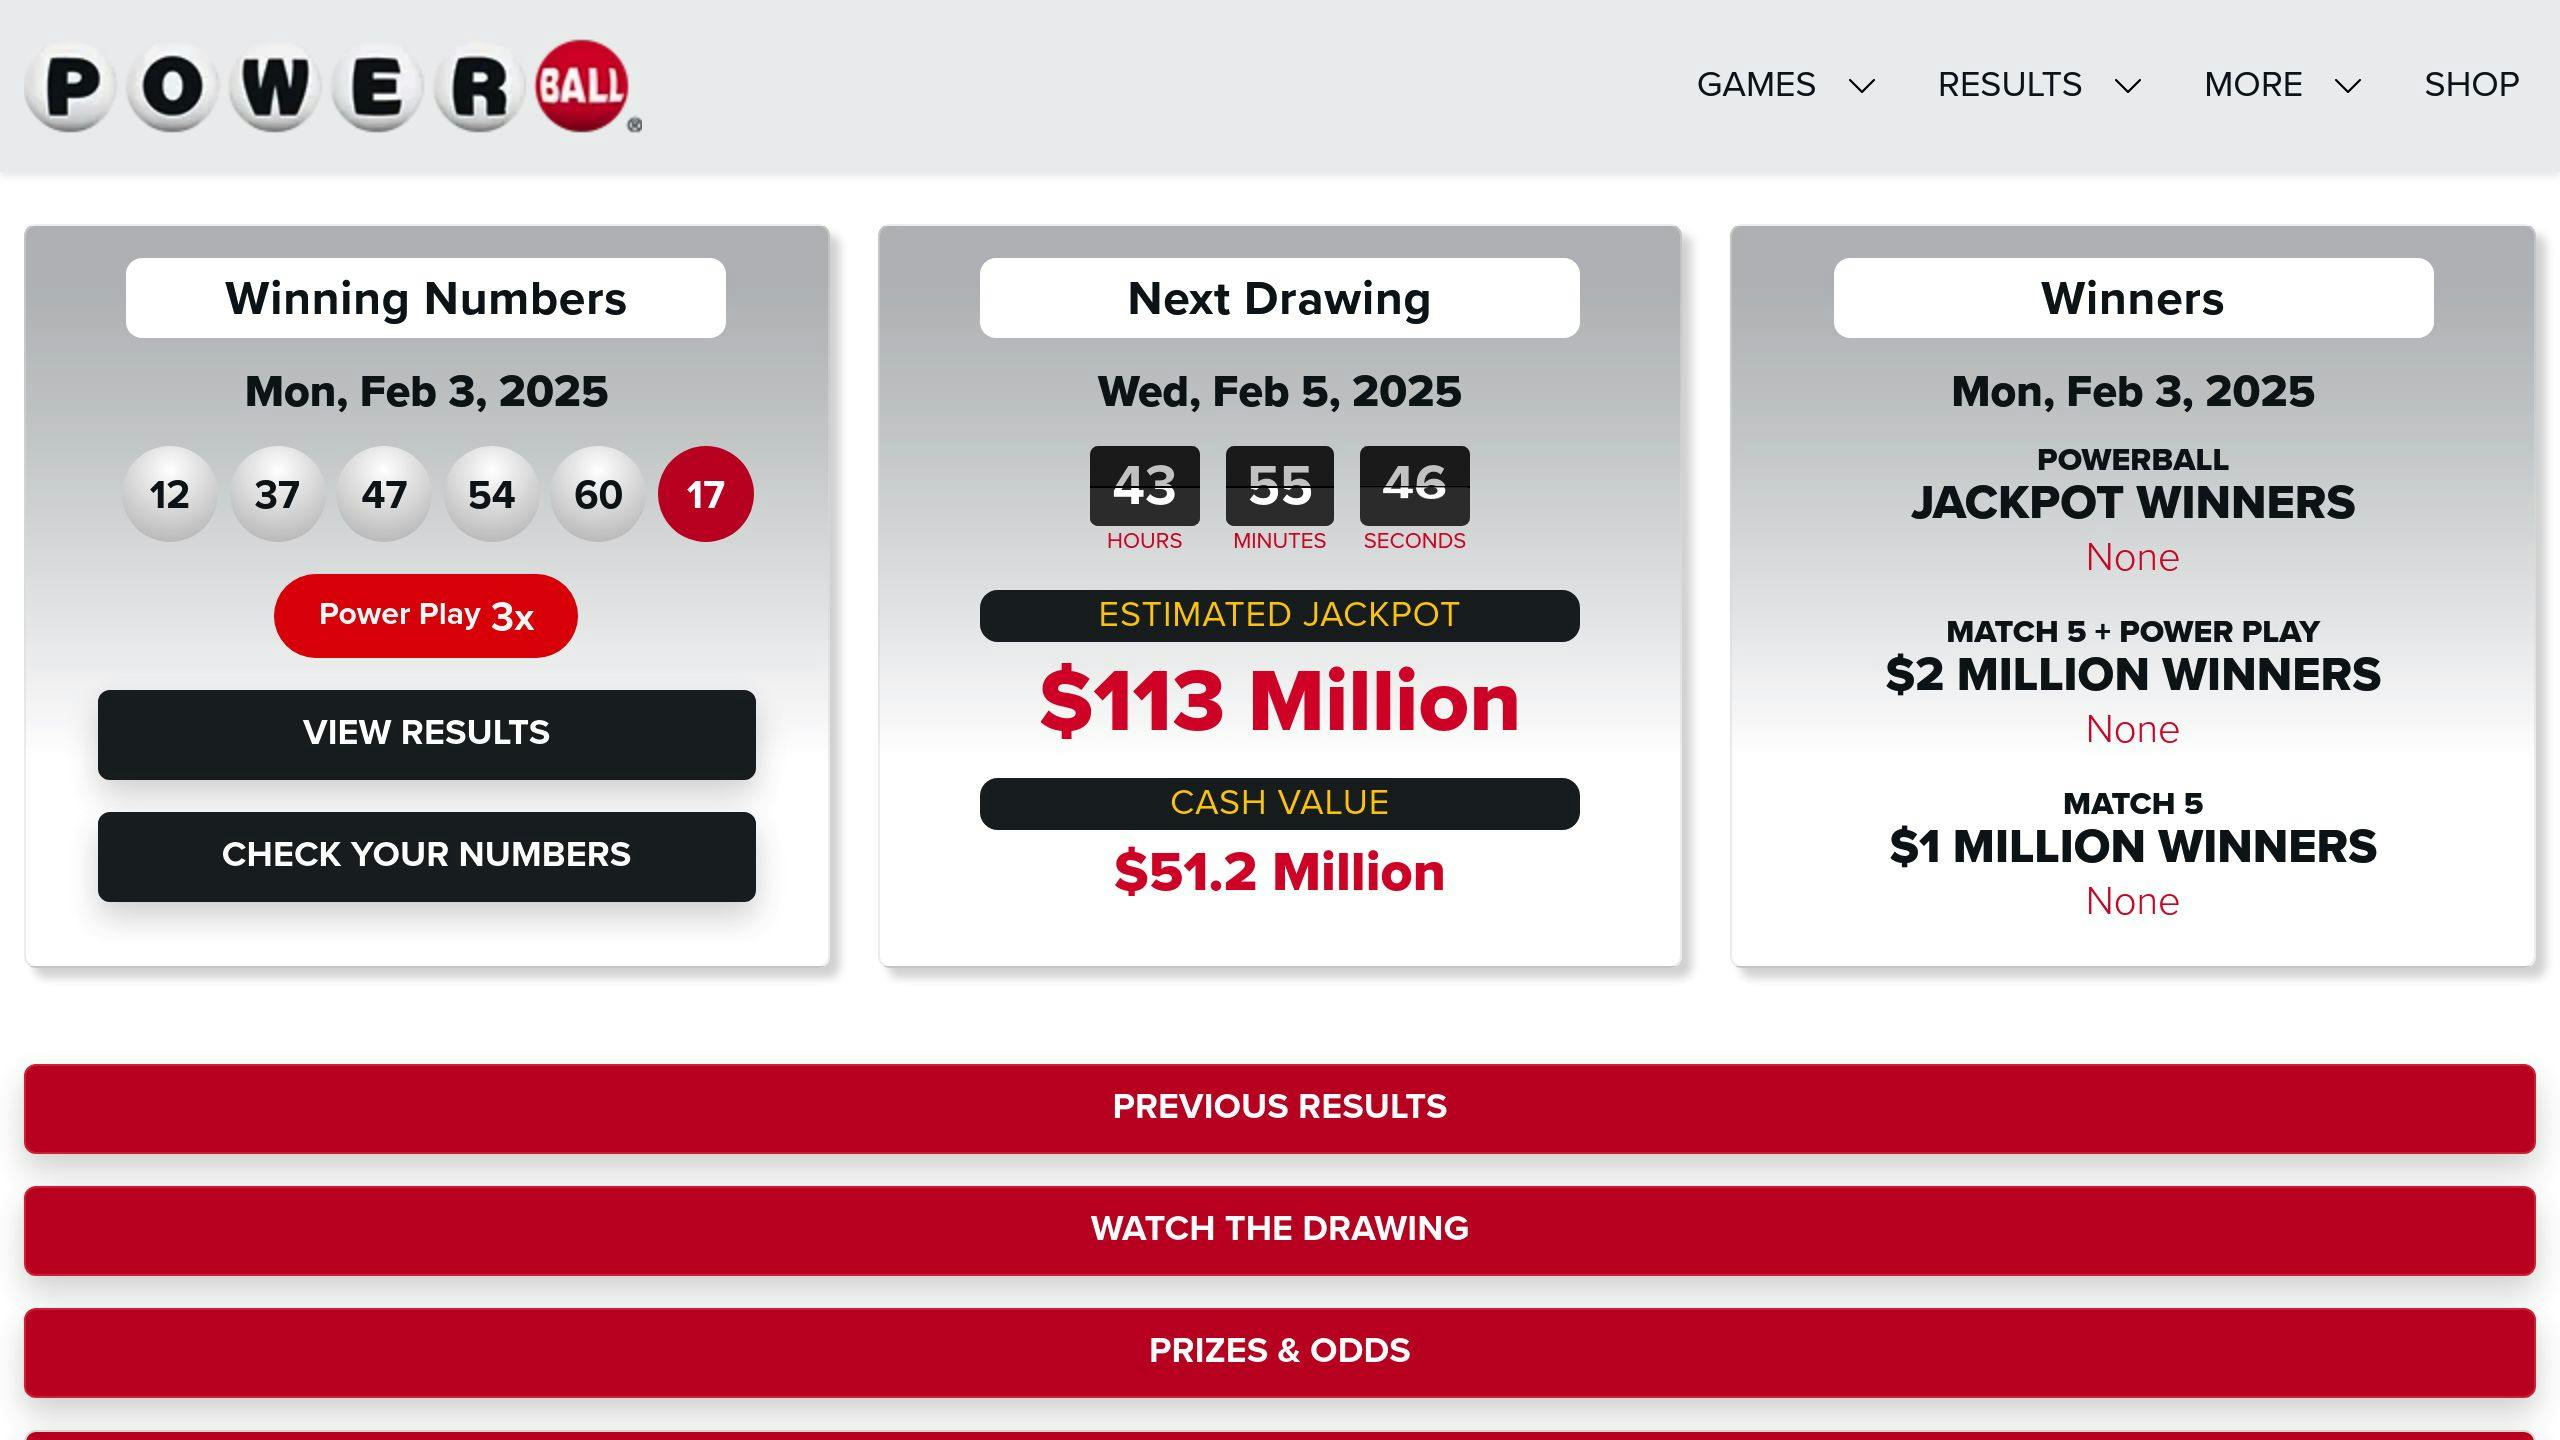
Powerball and Mega Millions are famous for their enormous jackpots. Powerball offers slightly better odds of winning the jackpot at 1 in 292,201,338, compared to Mega Millions’ odds of 1 in 302,575,350. Both games start with a minimum jackpot of $20 million. Powerball holds the record for the largest jackpot ever – an incredible $2.04 billion in 2022. Mega Millions isn’t far behind, with its highest prize reaching $1.537 billion in October 2018.
European Lotteries: EuroMillions and EuroJackpot
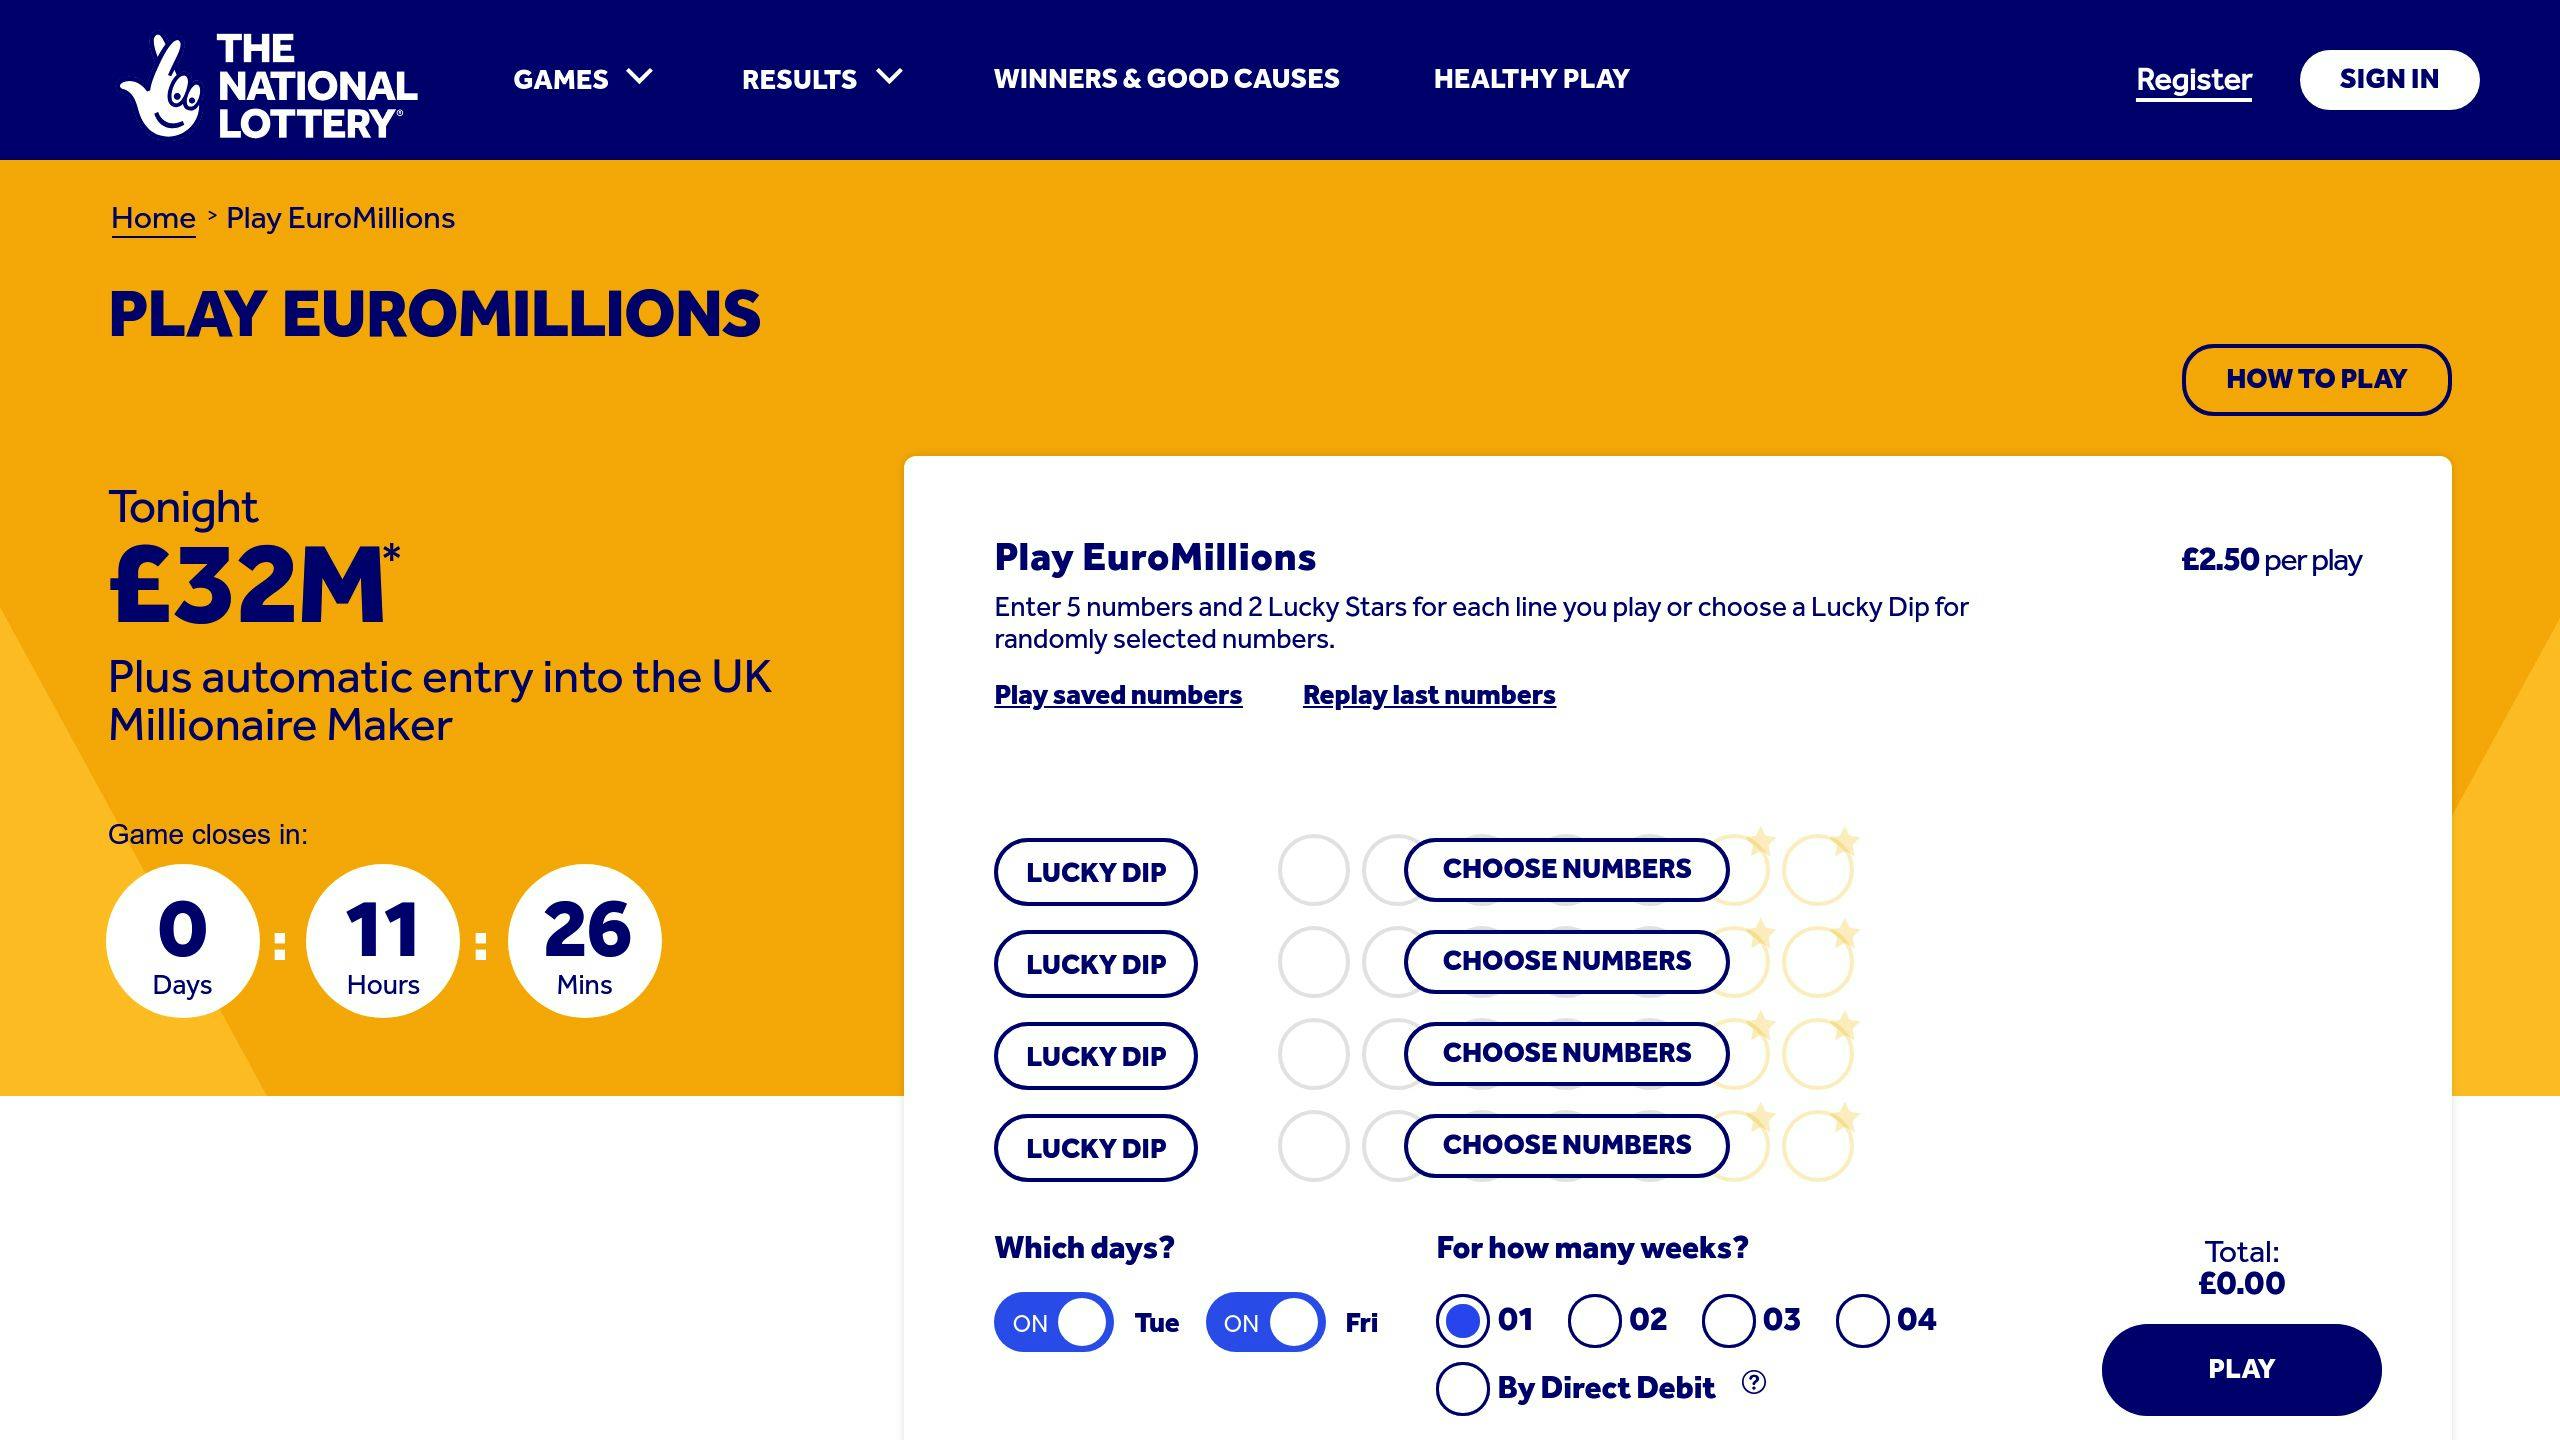
European lotteries tend to offer better odds for hitting the jackpot than their U.S. counterparts. EuroMillions has jackpot odds of 1 in 139,838,160 and overall winning odds of 1 in 13. EuroJackpot improves on the jackpot odds with 1 in 95,344,200, though its overall winning odds are lower at 1 in 49. EuroMillions caps its jackpot at €250 million, while EuroJackpot’s maximum is €120 million.
| Lottery | Number Format | Jackpot Odds | Overall Winning Odds | Min. Jackpot |
|---|---|---|---|---|
| Mega Millions | 5/70 + 1/25 | 1:302,575,350 | 1:24 | $20 million |
| Powerball | 5/69 + 1/26 | 1:292,201,338 | 1:24.9 | $20 million |
| EuroMillions | 5/50 + 2/12 | 1:139,838,160 | 1:13 | €17 million |
| EuroJackpot | 5/50 + 2/10 | 1:95,344,200 | 1:49 | €10 million |
While the odds of winning a jackpot are undeniably slim, understanding these numbers can help you weigh your options and approach lottery games with a clearer perspective.
What Affects Lottery Odds
Lotteries around the world may have different formats, but a few key elements always play a role in determining your chances of winning. Let’s break down the main factors that influence lottery odds.
Ball Count and Number Pool Size
The total number of balls and the size of the number pool are the biggest factors affecting your odds. For instance, in a 6/49 lottery, the odds of hitting the jackpot are 1 in 13,983,816. If the pool size increases to 60 numbers, the odds become nearly four times tougher. Games like Powerball, which use a 5/69 + 1/26 format, feature even larger pools, resulting in odds of 1 in 292,201,338 for the jackpot.
| Lottery Format | Number Pool Size | Jackpot Odds |
|---|---|---|
| Basic 6/49 | 49 numbers | 1:13,983,816 |
| 6/60 | 60 numbers | 1:50,063,860 |
| Powerball (5/69 + 1/26) | 69 main + 26 bonus | 1:292,201,338 |
Extra Numbers and Rules
Bonus balls and additional rules can make jackpots even harder to win. These features are designed to create multiple prize tiers, making it easier to win smaller prizes but significantly harder to hit the jackpot. To put it in perspective, the odds of being struck by lightning (1 in 15,300) are far better than winning most major lottery jackpots. This stark contrast shows just how much these extra elements impact your chances.
With these factors in mind, the next step is understanding tools and strategies to assess lottery odds more effectively.
sbb-itb-29f0076
Tools for Checking Lottery Odds
Understanding lottery odds can be straightforward. Here are three methods to help you assess your chances and make smarter choices when playing.
Expected Value Method
The Expected Value Method helps you figure out the average return on a lottery ticket by factoring in the odds and prize value. It gives you an idea of whether buying a ticket makes financial sense. Here’s an example:
- Ticket cost: $1
- Jackpot: $10 million
- Odds of winning: 1 in 10 million
The calculation:
(1/10,000,000 × $10,000,000) – $1 = -$0.90
This result shows that, on average, you’d lose 90 cents per ticket.
Lower Prize Odds
Smaller prizes often come with better chances of winning. Take the Powerball lottery as an example, where the overall odds of winning any prize are 1 in 24.87 . Here’s how the odds and payouts compare across different prize levels:
| Prize Level | Typical Odds | Average Prize |
|---|---|---|
| Jackpot | 1 in 292,201,338 | Varies |
| Second Prize | 1 in 11,688,054 | $1,000,000 |
| Third Prize | 1 in 913,129 | $50,000 |
As you can see, smaller prizes are more achievable, even if the payouts are less life-changing.
Past Results Review
Looking at past lottery results can reveal patterns in prize distribution. However, keep in mind that every draw is random, and no numbers are ever "due" to appear. While this method won’t guarantee a win, it can help you better understand how prizes are awarded.
These approaches can help you make better decisions about which games to play and how much to spend. Up next, let’s tackle some common myths that often mislead lottery players.
Lottery Odds Myths
Many misunderstandings about lottery odds can lead players to false beliefs. Let’s break down three common myths to help you better understand how lotteries actually work.
Past Numbers Myth
Some people think past lottery results can influence future outcomes. This isn’t true. Each draw is completely independent. Think of it like flipping a coin: even if you’ve flipped heads ten times in a row, the chance of getting heads on the next flip is still 50%. Similarly, in Powerball, a number that hasn’t been drawn for 20 games still has the same odds – 1 in 69 for the white balls – of being picked in the next draw .
Lucky Numbers Myth
The idea of "lucky" numbers is a common belief in lottery culture. Whether you pick numbers based on birthdays, anniversaries, or intuition, the truth is that every number has the exact same chance of being drawn .
Interestingly, many players choose numbers between 1 and 31 because of their connection to calendar dates. While this doesn’t affect the odds of winning, it could mean splitting the jackpot with more winners if these numbers hit.
Winning Systems Myth
Systems like wheeling numbers, analyzing "hot" and "cold" numbers, or following betting patterns can’t change your odds . Every ticket is an independent event, and the odds remain the same no matter what strategy you use .
"Statistical analysis can show that past results do not influence future outcomes, and that every number has an equal chance of being selected", says the American Statistical Association .
The best approach to playing the lottery is to see it as entertainment, not a financial strategy. Set a budget you’re comfortable losing, and don’t fall for systems or patterns that claim to outsmart the game – they don’t work.
Conclusion
Winning the top prizes in major lotteries is no easy feat. With larger number pools and extra rules like bonus balls, the odds of hitting the jackpot are incredibly slim.
Knowing these odds helps players make smarter choices. Tools like the expected value method and debunking common lottery myths can guide you toward more informed decisions. Here are a few tips for responsible play:
- Focus on games where lower-tier prizes have better odds.
- Use the expected value method to evaluate if a ticket is worth it.
- Treat the lottery as a fun activity, not a way to make money.
While buying multiple tickets gives you a slightly better chance, the odds of winning remain very low. By understanding these probabilities and using the strategies discussed, you can enjoy playing with a clearer and more realistic approach.
FAQs
Here are answers to some common questions about lottery odds to help clear up any confusion.
How do lottery odds work?
Lottery odds show the likelihood of hitting the winning combination compared to all possible combinations. They depend on a few main factors:
- The total number of options in the pool
- How many numbers you need to choose
- Extra rules, such as bonus balls or additional numbers
Take Mega Millions as an example. The odds are tough – 1 in 302,575,350 – because you have to pick 5 numbers from a pool of 70, plus a Mega Ball from a separate pool of 25 numbers .
What is the formula for the lottery method?
Lottery odds are calculated using a combination formula that factors in the numbers you select and the total pool size. This can get more complicated with games that include bonus numbers or special rules, like Powerball or Mega Millions .
The formula generally considers:
- The total number of options in the pool
- How many numbers you need to choose
- Any extra rules or bonus numbers
These explanations aim to simplify the math behind lottery odds, making it easier to understand the chances involved when you play.